When I work with a customer for a health check of their VMware environment we have a set of internal tools we can leverage in our TAM organization. What is a TAM you may ask?, check out VMware Technical Adoption Manager
If a customer has VMware Aria Operations stood up, that is one of the first places I like to start to get an understanding of what we could find to clean up the environment. Think of it as getting rid of clutter so you can obtain a better visual. When I refer to waste, I’m talking about; PoweredOff virtual machines, virtual machines provisioned, left on and were never used for an intended purpose, snapshots! and finally orphaned disks, (aka Zombie VMDKs) as referred to by RVTools.
While Aria Operations is not the only tool that can achieve these tasks, it does make for a nice integration and the ability to track and report against it.
Check out a quick YouTube tutorial on using the ‘Reclaim’ feature in Aria Operations.
In another blog I documented how to deploy a Cloud Proxy appliance so that you can monitor Services in an operating system. You can check that out here ‘VMware Aria Operations Cloud Proxy Deployment‘
For the following post I want to demonstrate monitoring a SQL Server services on a Windows Server virtual machine.
In our test today, I’m running Windows Server 2016 with SQL Server Express LIte as a VM.
From within Aria Operations, I will want to now deploy the Telegraf agent. **Please take a snapshot and take any precautionary backups**
Locate the object you want to deploy the Telegraf agent to, select and from the ‘Actions’ menu select ‘Install’
Select the Monitoring Availability and Cloud Proxy instance below, in my case, I have a single Cloud Proxy deployed. Click Done.
You have a couple of options to ensure authentication to the VMs is taking place. Selecting the top option ‘Common username & password” will allow me to define. Selecting ‘Enter virtual machine credentials‘ will allow you to download a template and populate it with username and passwords to upload back into the appliance.
I’m defining local Administrator permissions for lab and click Next.
Screenshot missing but on the final click ‘Install’ and installation should begin and you may monitor status in Aria Operations
Not too long, you should see a successful installation
With a few minutes, the agent should start reporting in new object data from the Windows Server instance and discover services. If you go to Configure>>Application Services
If you click on the ‘discovered’ in the Microsoft SQL Server service, it should take you to a list of monitoring features.
Now that we have discovered services, we can select what we want to configure and even add from ‘Custom Monitoring’. To ensure we are alarmed if a SQL service was to fail, we will select ‘Microsoft SQL Server’ and select Activate Service
We will select ‘Microsoft SQL Server’ click Confirm
The right-pane will bring up the following configuration menu, fill it out and click ‘Save’
In order to make this work I did have to enable port 1433 on my SQL instance to get the DB Instance to communicate with the collector, please work with your server and dba teams.
Monitor the configuration
Once configuration is successful you should now find the server in inventory deployed with an agent and reporting it in application data.
You can now bring up the object in Aria Operations and find additional data being pulled in from the DB Instance
You may also dive into associated Metrics for the SQL DB instance and start monitoring.
I hope this was found helpful and please ensure you follow best practices by taking snapshots, following associated documentation for your GuestOS and VMware.
There was a recent Microsoft Windows Update released for Windows Server 2022, when applied to VMs that have Secure Boot enabled, on reboot the VM boots directly into the BIOS and never hits the OS bootloader.
This not only posed a challenge but there are environments that may have couple of hundred VMs to a few thousands. For those those customers that have entitlement to Aria Operations or Aria Operations Cloud (formerly vRealize Operations) customers can generate a inventory report of VMs that contain that value with a few customizations.
Before I get into the steps I have to give credit to Brock Peterson for showing me the ropes on this. Check out his personal blog BrockPeterson.com.
In this example I’m running vROps 8.10.2 on-prem. The first step will be to modify the existing Active policy. From the vROps homepage go to Configure >> Policies. From here you should see the name of the default policy that comes out the box when you install vROps. Also notice the ‘Status’ column and it’s labeled as ‘Active’
From here you have two options in how you want to get to the edit. For the first option you can edit the entire policy by clicking ‘Edit Policy’
or
If you know which part of the policy you want to modify, you can click on the individual setting from within the policy itself
We will select ‘Metrics and Properties’
Begin typing ‘Virtual Machine’ and select the first one that says ‘Virtual Machine’
The following Metrics and Properties relating to Virtual Machines will appear, you can drill down and find the desired setting or you can even use a filter option.
From Properties>>Configuration>>Security>> ‘EFI Secure Boot enabled’ by default is set to ‘Deactivated’, click on the drop-down menu and select ‘Activated’
Click ‘Save’ and exit out, you may want to wait 5-10 minutes for vSphere to perform a collection an scan of the objects.
The next step will be adding the newly activated property to a ‘View’ so that we can generate a report that contains that modified View.
Click on the ellipses to open a menu and select ‘Edit’
When the Edit View appears, you want to go to ‘2. Data’ section and in step 2 you can either perform a keyword search or drill down the options.
From there on Step 3 highlight the property and drag it into the existing View and place it in your desired location. I personally chose to have it come after ‘Hardware Version’
In the ‘Configuration’ section, the ‘Metric name’ is the default name, however you can choose to change it in the ‘Metric label’
Click ‘Update’
In the Preview Source you will see a sample of the report with your data already generated.
Now you can go to the ‘Reports’ section and find the ‘Inventory Report – Virtual Machines’ and run the report.
In the following example, this is a preview of the PDF version of the report. However you can export to CSV and help track those VMs and attend to any maintenance or troubleshooting.
Whether you are running VMware Cloud Foundation (VCF) or standalone vRealize LifeCycle Manager instance managing your vRealize products, the following management pack for vRealize Operations will help give a health monitoring dashboard to your solutions. You can monitor capacity growth over time as well as certificate monitoring.
You can obtain the management pack couple of different ways. One way is through the VMware Marketplace, download the pack and upload to the vRSLCM via SCP.
Always check the Marketplace carefully for management pack versions, publisher and release notes.
The other method to access the Marketplace through the vRealize Lifecycle Manager
In the lab I downloaded the pack and uploaded it to the following location on the appliance
Once uploaded, jump into the vRSLCM appliance, you can see here in the Environment section it shows no information available for Health and the ‘i’ icon explains what we need to do.
From the vROps Environment, click ‘View Details’, once inside the vROps environment, click on the ellipses and you will a pre-built action to install the SDDC Management Pack.
Once prompted I placed /data/marketplace and click Discover, this found the file I downloaded and uploaded. Click Submit
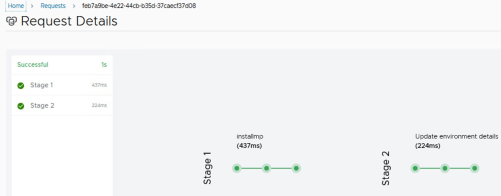
The Request page updates to Successfully deployed
After about 15-20 minutes, you will find health is Green now.
What to do next? Check out the newly installed dashboards in vROps.